Regionalbahn Between Bremen and Hannover
Mar 17, 2018 • Arne VogelWhile traveling with the Deutsche Bahn I noticed that they broadcast amongst others the speed and the position of the train under this url: https://www.wifi-bahn.de/schedule.jason
This is the result of logging the positions and speeds and plotting them with R’s ggmap:
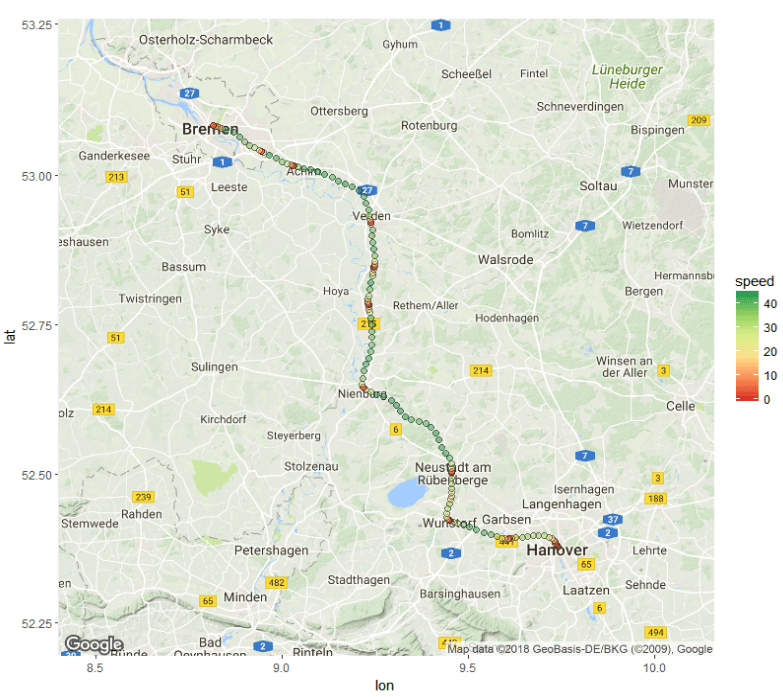
The speed is in m/s, each point is after 30 seconds.
Logging with: bahnlog.py
Plotting with: bahn.Rmd